Understanding Schemas in Power BI: Best Practices and Tips
Greetings from ARTIFICALAB LTD!
Welcome to ARTIFICALAB LTD! If you’re a new learner or beginner, we strongly believed that understanding schemas is crucial for easy and efficient data modeling in Power BI. This is because schemas help organize and structure your data, making it easier to analyze and visualize.
In this blog, we’ll explore the different types of Power BI data schemas, their real-world use cases, benefits and drawbacks, as well as giving you the best practices for designing schemas, common mistakes to avoid, and how to choose the right schema for your business case.

"Data Schemas are the crucial component of Data Modeling Topic that every Professional Data Analyst should understand. Regarding with Microsoft Power BI, a powerful Business Intelligence Tool, I suggest learners to study Star Schema, Snowflake Schema and Galaxy Schema so that they can build up Data Models in Power BI quickly and easily."
— Mr. Thu Ta Naing, Founder & CEO (ARTIFICALAB LTD), PL-300 Power BI Certified Data Analyst
How many types of Power BI Data Schemas exist?
In Power BI, there are several types of data schemas you can use to model your data. What I can say is that the most common ones are:
-
Star Schema
-
Snowflake Schema
-
Galaxy Schema
1. Star Schema
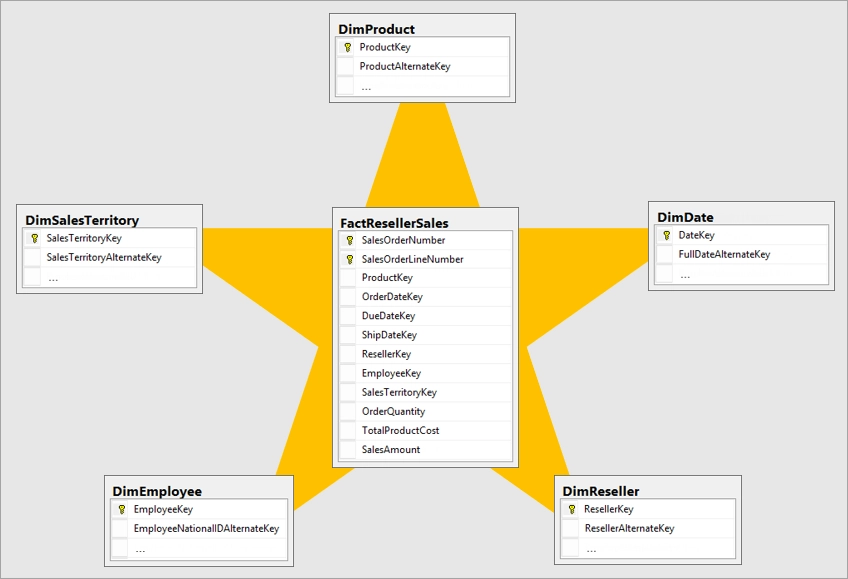
The Star Schema is the simplest type of data schema. If you check with the below figure, it consists of a central fact table connected to multiple dimension tables. Each dimension table is directly related to the fact table, forming a star-like structure.
Real-World Use Cases:
The very basic simple Star Schema could be used in Retail sales analysis, Inventory management, and Financial reporting case studies.
Benefits of utilizing this Star Schema:
Generally speaking, Star Schemas are simple and easy to understand. In fact, they are also efficient for querying and reporting while reducing the complexity of joins.
Drawbacks of utilizing this Star Schema:
However, there are some drawbacks regarding on this schema. First of all, there is a possibly that redundancy could still exist in dimension tables. And another fact is that it might not be suitable for complex data relationships at all.
So, to solve this issues, we got another upgraded extended version of this Star Schema, which is also known as Snowflake Schema.

Figure: Star Schema Data Model, Image Courtesy of Microsoft Inc.
2. Snowflake Schema
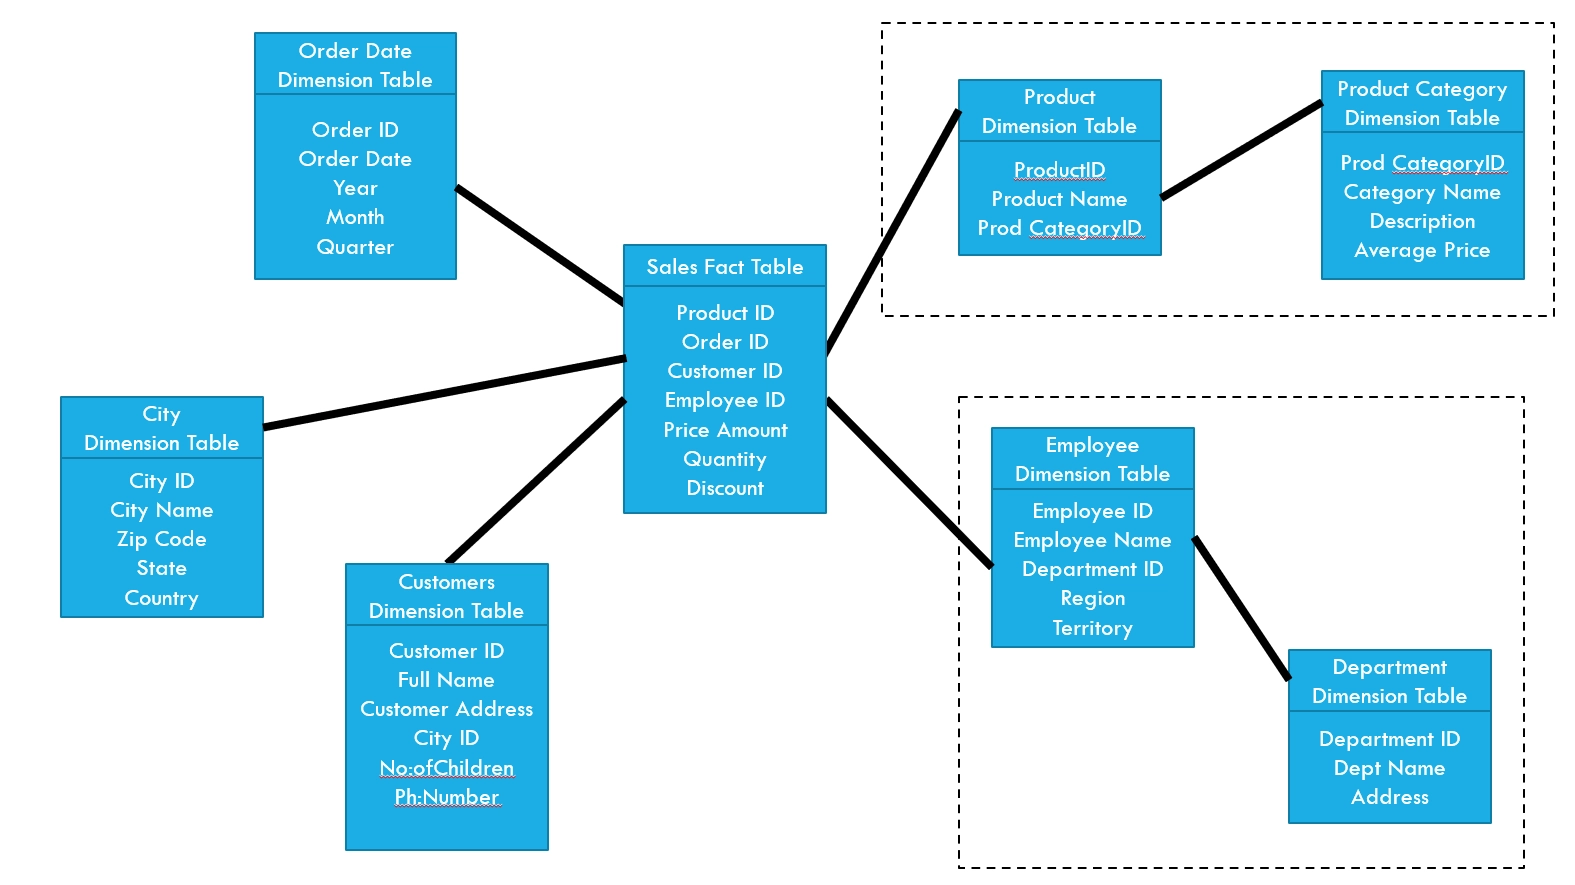
There we go, an upgraded version of Star Schema. Indeed, the Snowflake Schema is often regarded as a more complex version of the Star Schema. This is because in this Snowflake Schema, dimension tables are normalized, meaning they are split into additional tables. This creates a snowflake-like structure.
Real-World Use Cases:
So, let's explore some of the real-world use cases on this Snowflake Schema. With additional add-ons for Normalization, this Snowflake Schema can now handle complex business intelligence applications. Meanwhile, it is suitable also for data warehouses with large and diverse datasets as well.
Benefits of utilizing this Snowflake Schema
As with increased normalization with additional dimension tables, using this Snowflake Schema could reduce data redundancy, as well as increased efficient storage and better data integrity as well.
(Note: if you don't understand what are dimension tables, please don't worry, we got you covered in another post!)
Drawbacks of utilizing this Snowflake Schema
However, there are some drawbacks. Snowflake Schemas are more complex to design and maintain. In addition, regarding performance, using Snowflake Schema results in slower query performance due to multiple joins.

Figure: Snowflake Schema Data Model, Image Courtesy of ARTIFICALAB LTD
3. Galaxy Schema
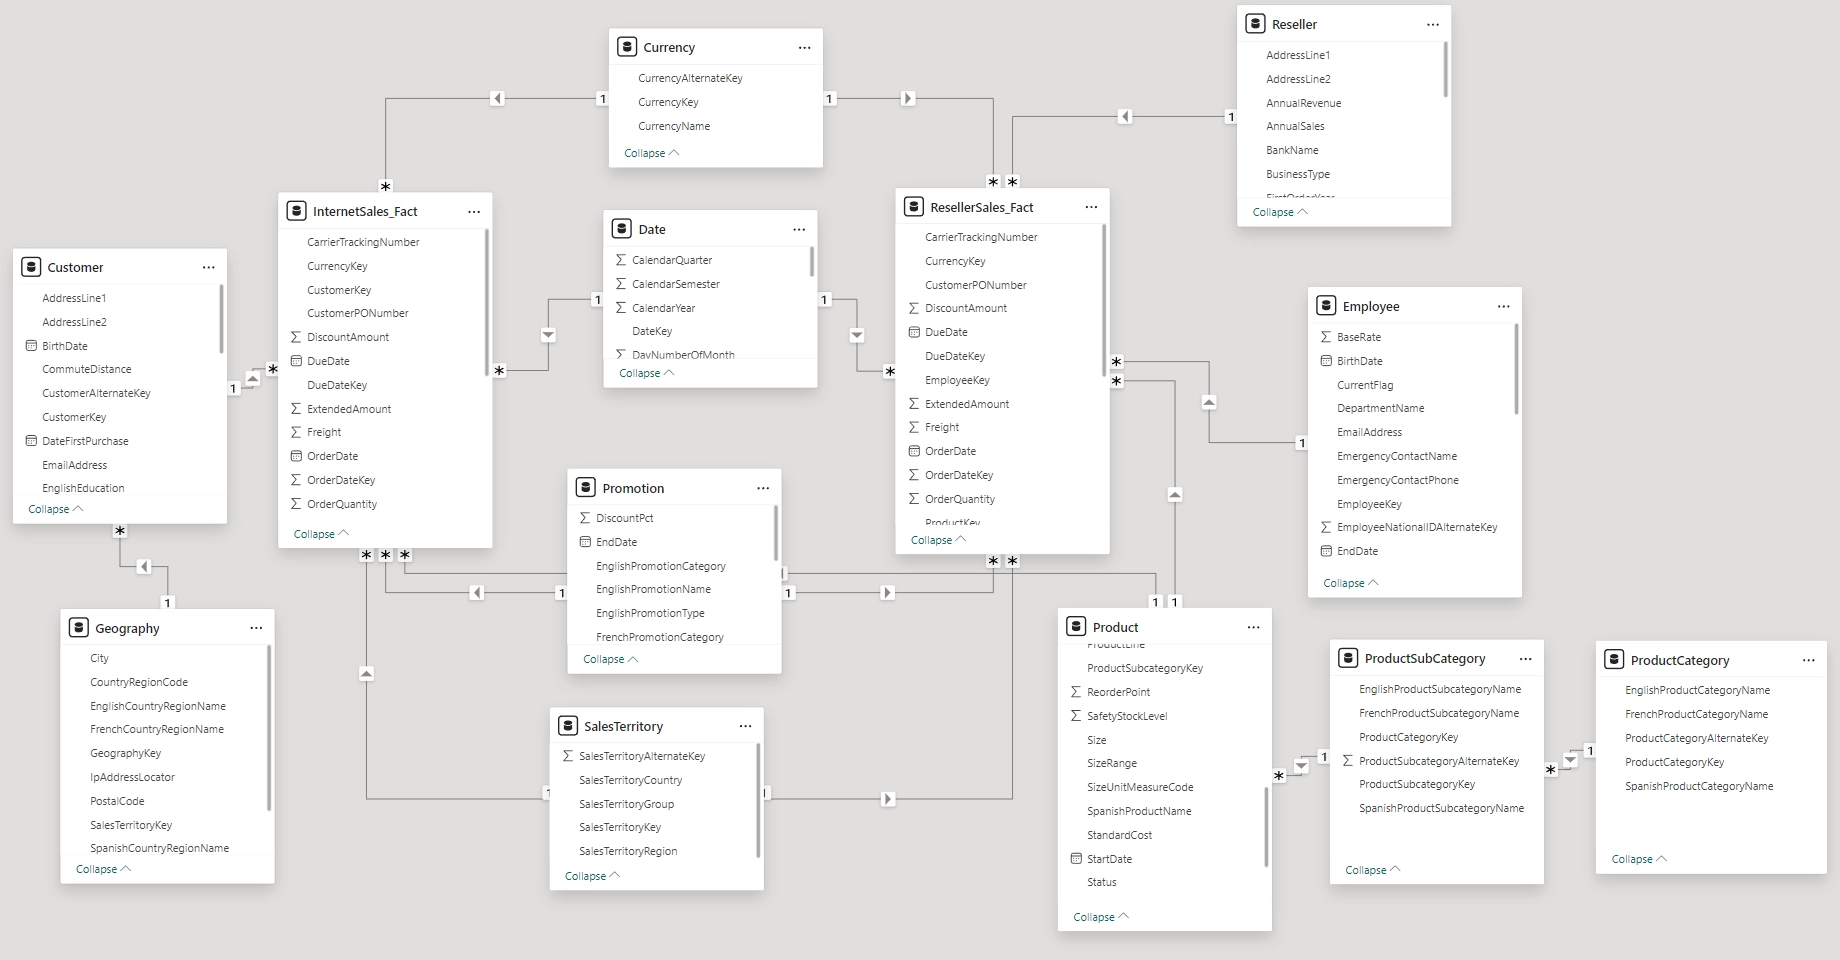
The next Data Schema you should explore is the Galaxy Schema. Generally speaking, the Galaxy Schema is also known as the Fact Constellation Schema, which consists of multiple fact tables sharing dimension tables. This schema is used for complex data models with multiple fact tables.
Real-World Use Cases:
It could be used in Enterprise-level data warehouses and Multi-subject data analysis.
Benefits of utilizing this Galaxy Schema:
Similar to previous Snowflake Schema, this Galaxy Schema also supports complex data relationships. In fact, it is flexible and scalable as well as efficient for large datasets.
However, the main difference is that Galaxy Schema consists of at least two Fact tables while the previous Snowflake Schema only consists of one Fact table!
Drawbacks of utilizing this Galaxy Schema:
There are some drawbacks you should note down in this schema! This Galaxy Schema is absolutely highly complex to design and manage while it also requires advanced knowledge of data modeling.

Figure: Galaxy Schema Data Model, Image Courtesy of ARTIFICALAB LTD
Best Practices You Should Follow When Designing Schemas
1. Understand Your Data and Business Goals:
Before designing your schema, have a clear understanding of your data and the business questions you need to answer.
2. Use the Right Schema:
Choose the schema that best fits your data complexity and reporting needs. For simpler models, a Star Schema might be sufficient, while more complex models may benefit from a Snowflake or Galaxy Schema.
3. Normalize Where Necessary:
Use normalization to reduce redundancy and improve data integrity, especially in complex schemas like the Snowflake Schema.
4. Optimize for Performance:
Avoid excessive joins and complex relationships that can slow down query performance. Use indexing and partitioning where appropriate.
5. Maintain Data Integrity:
Ensure that your schema design supports data accuracy and consistency. This includes using primary and foreign keys correctly.
Common Mistakes to Avoid When Designing Schemas
1. Overcomplicating the Schema:
Avoid making your schema too complex with unnecessary tables and relationships. This can lead to performance issues and difficulty in maintenance.
2. Ignoring Business Requirements:
Ensure your schema design aligns with the specific business needs and reporting requirements. A mismatch can result in ineffective data models.
3. Excessive Normalization:
While normalization reduces redundancy, overdoing it can lead to complex joins and slower query performance. Balance is key.
4. Poor Naming Conventions:
Use clear and consistent naming conventions for tables and columns to make your schema easier to understand and maintain.
5. Neglecting Data Quality:
Ensure that the data being modeled is clean and accurate. Poor data quality can undermine the effectiveness of your schema.
How to Choose the Right Schema for Your Business Case
1. Assess Data Complexity:
For simpler datasets with straightforward relationships, a Star Schema is often sufficient. For more complex datasets with multiple layers of relationships, consider a Snowflake or Galaxy Schema.
2. Evaluate Reporting Needs:
Determine the types of reports and analyses you need to generate. If you require detailed, multi-dimensional analysis, a Snowflake or Galaxy Schema may be more appropriate.
3. Consider Performance Requirements:
If query performance is critical, a Star Schema might be the best choice due to its simplicity and efficiency. For larger datasets, ensure your schema design supports efficient querying.
4. Understand Maintenance Capabilities:
Consider the resources and expertise available for maintaining the schema. More complex schemas like Snowflake and Galaxy require advanced knowledge and ongoing maintenance.
5. Align with Business Goals:
Ensure that the chosen schema supports your overall business objectives and provides the necessary insights for decision-making.
Examples of Power BI Reports Using Different Schemas
1. Star Schema Example:
Report: Retail Sales Dashboard
Description: This report uses a Star Schema to analyze sales data, providing insights into sales performance, inventory levels, and financial metrics.
2. Snowflake Schema Example:
Report: Customer Insights Report
Description: This report uses a Snowflake Schema to provide detailed insights into customer behavior, preferences, and demographics, supporting complex business intelligence needs.
3. Galaxy Schema Example:
Report: Enterprise Data Warehouse Report
Description: This report uses a Galaxy Schema to analyze data from multiple business units, providing a comprehensive view of enterprise performance across various dimensions.
CONCLUSION
Thanks for reading this blog post! If you would like to study more, check out our Power BI courses from our ARTIFICALAB LTD website portal, or head over to the Udemy platform, where we teach our courses. Happy learning and happy data modeling!


