Power BI’s Journey to the Top: A Decade of Dominance in the Magic Quadrant
Welcome to ARTIFICALAB LTD back again! In this article, we will explore the remarkable achievements of Power BI, a leading Business Intelligence (BI) platform, and its consistent dominance in the Gartner Magic Quadrant over the past decade. Join us as we delve into how Power BI has revolutionized the BI landscape and maintained its leadership position year after year.

"I strongly believed that Power BI Business Intelligence Platform will still be the Dominant Leader in the next 10 years. Backed by Microsoft, and its seamless integration of Azure Cloud and other Microsoft Platforms make it unique and differentiate from any other competitor Business Intelligence Software on this planet!
Therefore, If you want to learn and become as a Professional Data Analyst or Professional Business Analyst, I strongly recommend to learn Power BI first than any other in the market. We, as ARTIFICALAB LTD, offer comprehensive PowerBI Courses that equip you unique skillsets and practical Power BI projects' experience that you cannot find in any other courses!"— Mr. Thu Ta Naing, Founder & CEO (ARTIFICALAB LTD), PL-300 Certified PowerBI Data Analyst
What is the Magic Quadrant?
For now, if you ever haven't heard this Magic Quadrant before, don't worry, we got you covered! In this blog, we will show you what Magic Quadrant actually is, and how we compare different Analytics & Business Intelligence Software within the Quadrant!
Indeed, the Gartner Magic Quadrant is a research methodology and graphical representation that provides a comprehensive analysis of a market’s direction, maturity, and participants. That is, it evaluates technology providers based on their ability to execute and completeness of vision. Four quadrants exist in this Magic Quadrant: Leaders, Challengers, Visionaries, and Niche Players.
Moreover, each quadrant represents the business intelligence software's abilities and expertise compared with other alternatives.
As a result, by using this Magic Quadrant, organizations can make informed decisions by highlighting the strengths and weaknesses of various vendors.
Power BI in the Magic Quadrant: Year by Year
Regarding this Power BI Business Intelligence Software, I have attached the Gartner's Magic Quadrant from Year 2020 to Year 2024, where Power BI is crowned as the Leader in Business Intelligence Software due to its ever-improving new features, strong support team by Microsoft, as well as its superb usability than its competitors!
Therefore, over the past five years, Power BI has consistently been recognized as a Leader in the Magic Quadrant for Analytics and Business Intelligence Platforms. Here’s a year-by-year breakdown of its performance:
Year 2020:
Power BI was praised for its robust data visualization capabilities and integration with Microsoft Azure, securing its position as a Leader.
The following is the Gartner's Magic Quadrant for Analytics and Business Intelligence Platforms, where Microsoft Power BI is crowned as a Leader position! (See top right corner)
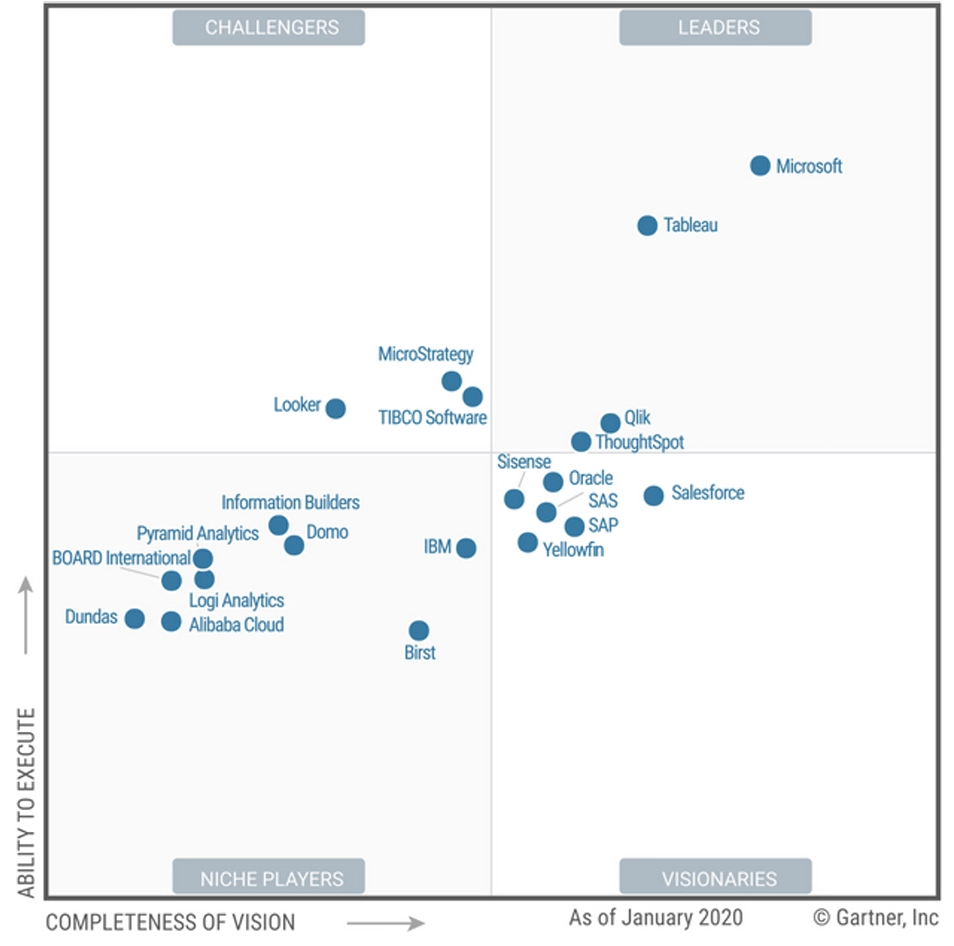
Figure: Magic Quadrant for Analytics and Business Intelligence Platforms, Image courtesy of Gartner Report 2020
Year 2021:
Continued innovation and user-friendly features from Microsoft Power BI Development team helped Power BI maintain its leadership, with notable enhancements in AI-driven analytics, as shown in below 2021 Magic Quadrant.
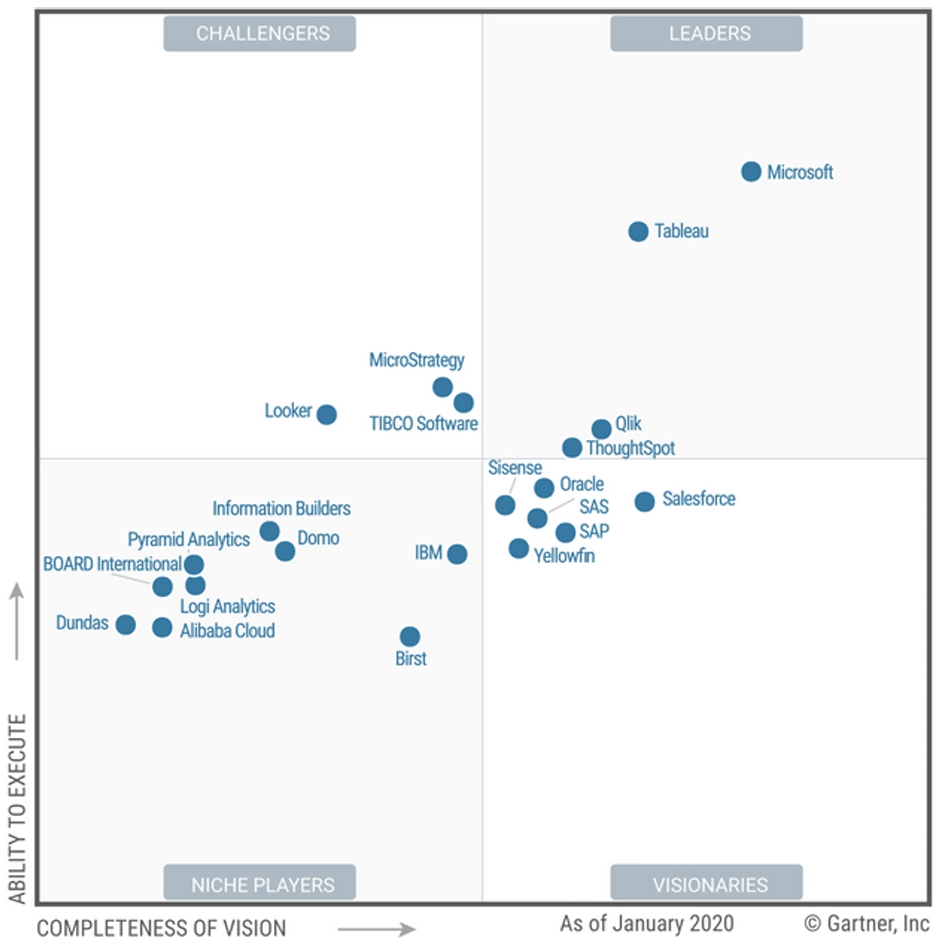
Figure: Magic Quadrant for Analytics and Business Intelligence Platforms, Image courtesy of Gartner Report 2021
Year 2022:
Still continued its success, in 2022, Power BI’s seamless integration with other Microsoft products and its strong community support become one of the key factors in its top ranking. From 2022, Microsoft upgraded its Power BI capabilities including new User Interface, new Innovative Business Intelligence Features which includes the integration of Azure Machine Learning and other Microsoft's AI capabilities!
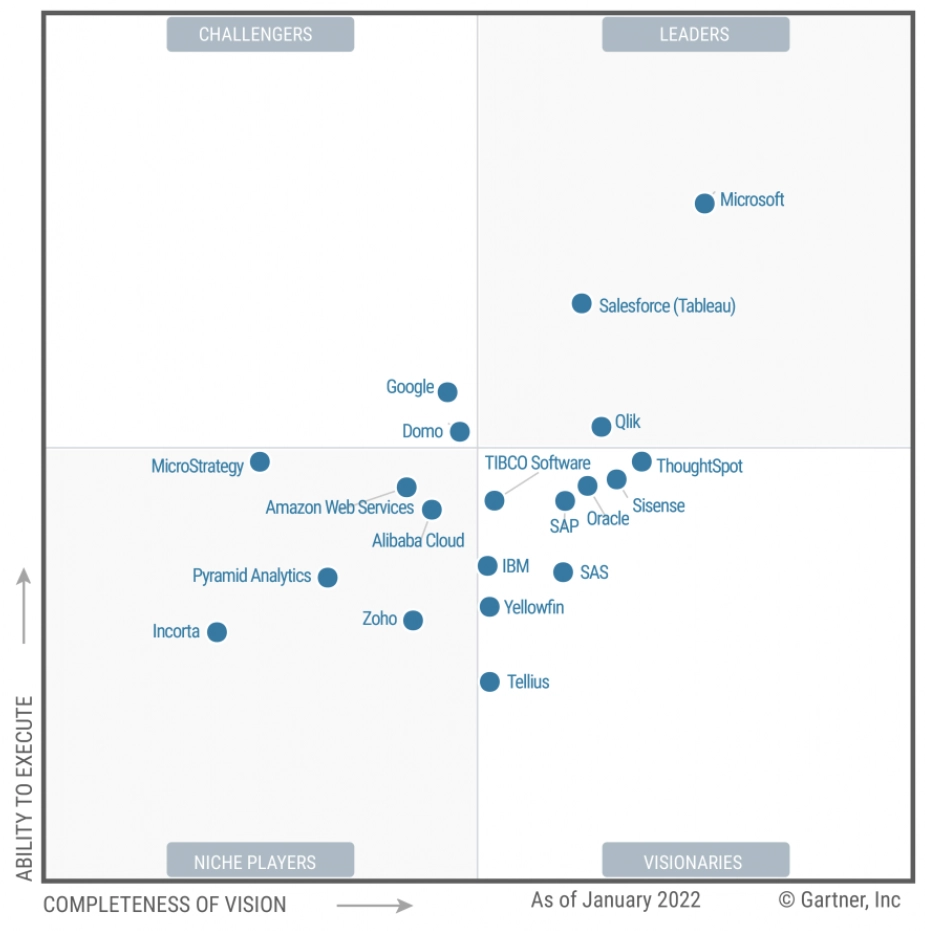
Figure: Magic Quadrant for Analytics and Business Intelligence Platforms, Image courtesy of Gartner Report 2022
Year 2023:
Power BI was recognized for its comprehensive vision and ability to execute, further solidifying its dominance in the BI market. The Power BI was still considered as the market leader of Business Intelligence in this Gartner's Magic Quadrant!
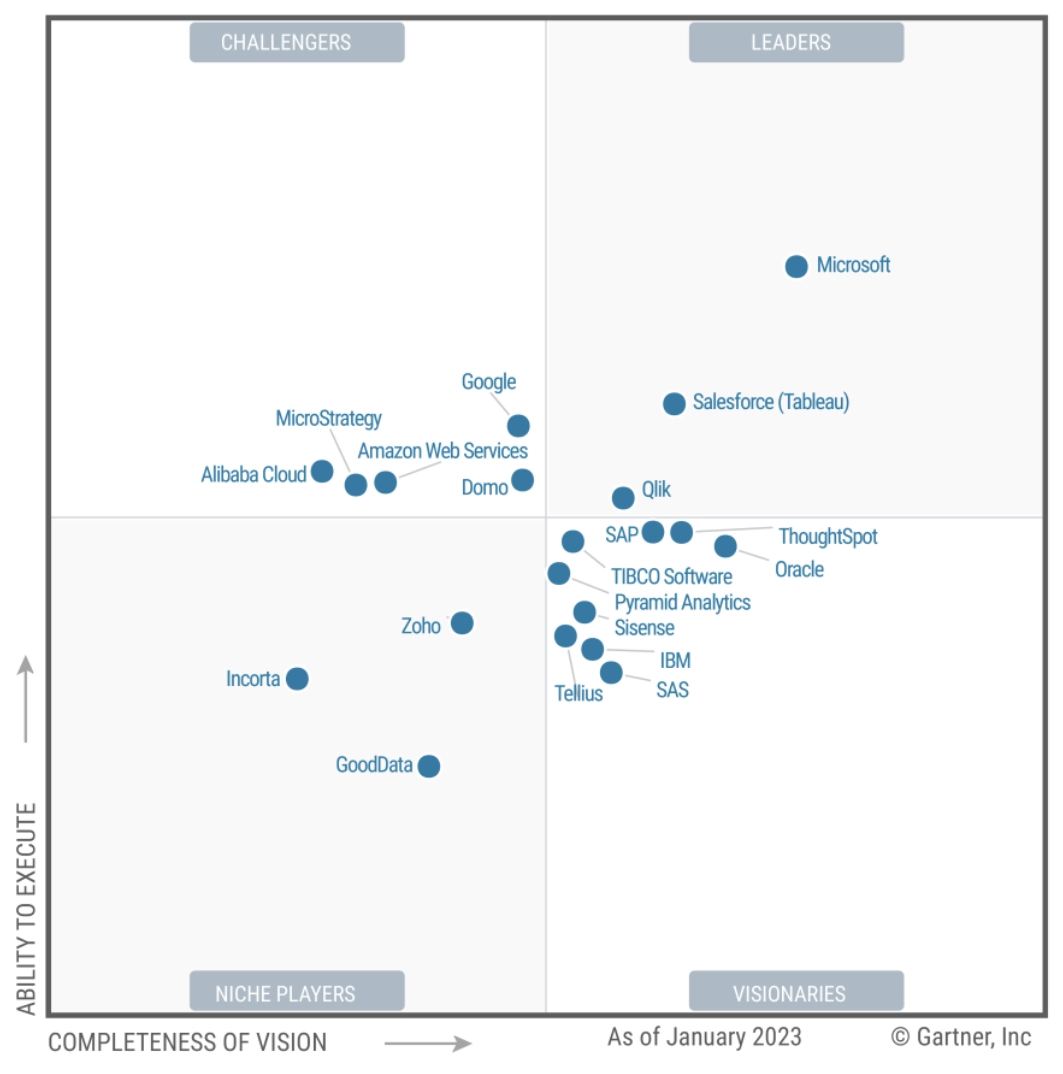
Figure: Magic Quadrant for Analytics and Business Intelligence Platforms, Image courtesy of Gartner Report 2023
Year 2024:
Power BI continued to lead with advanced analytics, real-time data processing, and enhanced collaboration features. We strongly believed that Power BI will continue to maintain its dominant position and leader in the market, and stay innovative with current latest trends and technology!
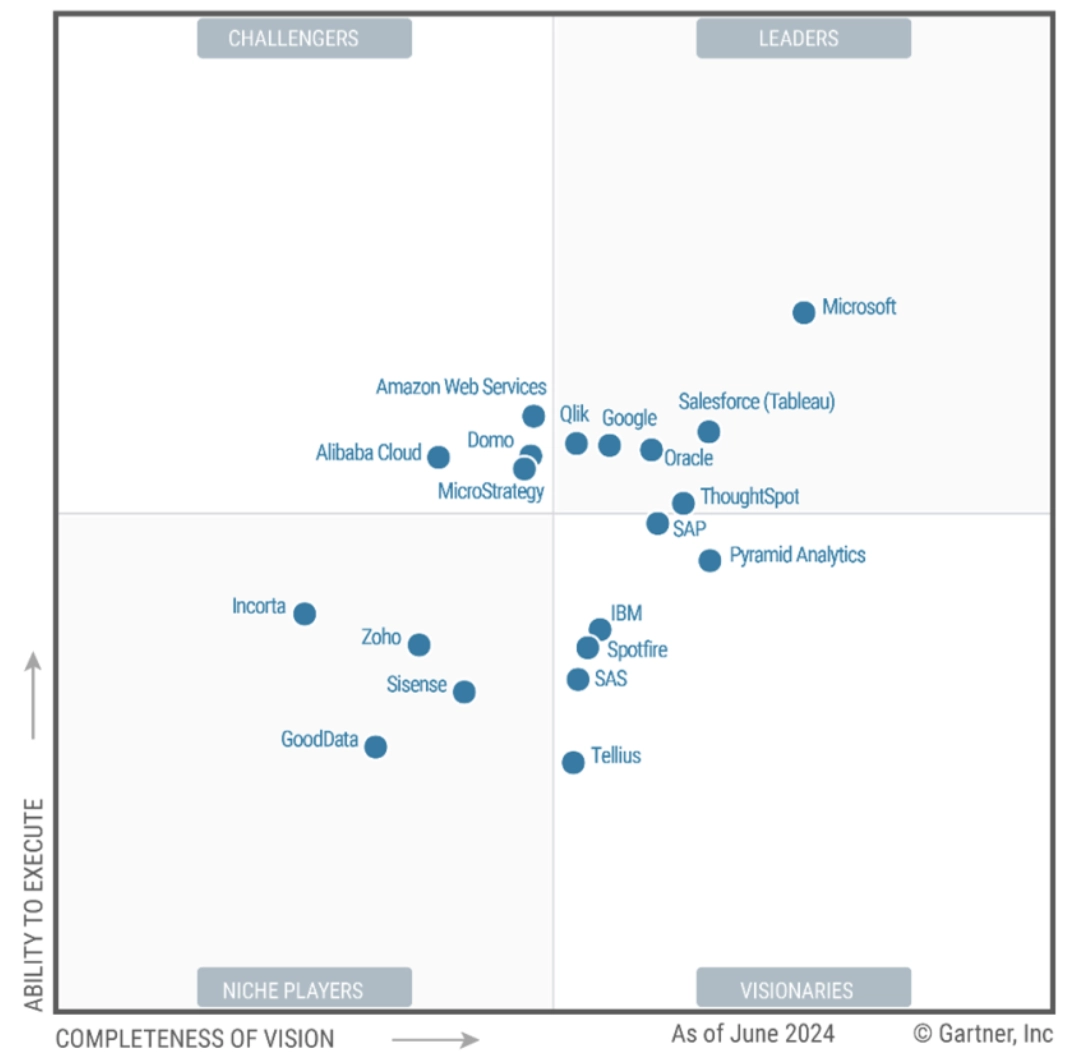
Figure: Magic Quadrant for Analytics and Business Intelligence Platforms, Image courtesy of Gartner Report 2024
Exploring more about the Power Platform
Besides the Magic Quadrant, if you explore more about Power BI, the software is not considered alone in terms of Microsoft Strategic Vision. In fact, the Microsoft Power Platform exists with the integration of all the Microsoft Power Softwares integrated and work together to seamlessly process the Business Objectives!
In fact, Power BI is a crucial component of the Microsoft Power Platform, which also includes Power Automate, Power Apps, and Power Virtual Agents. Together, these tools enable organizations to automate workflows, build custom applications, and create intelligent chatbots, all while leveraging the powerful analytics capabilities of Power BI.
Below are some of the others integrated with Power BI!
Power Automate:
Automates repetitive tasks and integrates seamlessly with Power BI to trigger actions based on data insights.
Power Apps:
Allows users to build custom applications that can interact with Power BI dashboards and reports.
Power Virtual Agents:
Enables the creation of chatbots that can provide data-driven responses using Power BI insights.
The Unique Advantage: How Power BI is seamlessly integrated with Microsoft Azure Cloud!
When you consider Power BI as a working professional tool and platform in the long term, whether for management reports, or business data analytics or more, integration with Microsoft Azure Cloud becomes a crucial factor to extend beyond normal capabilities of ordinary Business Intelligence Software.
Therefore, Power BI’s integration with Azure Cloud is one of the key factors that contribute to its strength and versatility as a Business Intelligence tool. Here are some of the ways this integration enhances Power BI:
1. Scalability and Performance
Azure Cloud provides the infrastructure that allows Power BI to handle large volumes of data efficiently. This means that as your data grows, Power BI can scale seamlessly to accommodate it without compromising on performance.
2. Data Connectivity
Power BI can connect to a wide range of data sources hosted on Azure, such as Azure SQL Database, Azure Data Lake, and Azure Synapse Analytics. This connectivity ensures that users can easily access and analyze their data stored in the cloud.
3. Security and Compliance
Azure offers robust security features, including data encryption, identity management, and compliance with various regulatory standards. By leveraging Azure’s security capabilities, Power BI ensures that your data is protected and meets compliance requirements.
4. Advanced Analytics
Azure provides advanced analytics services like Azure Machine Learning and Azure Cognitive Services. Power BI can integrate with these services to incorporate machine learning models and AI-driven insights into your reports and dashboards, enhancing the analytical capabilities of your BI solutions.
5. Real-Time Data Processing
With Azure Stream Analytics, Power BI can process and visualize real-time data streams. This is particularly useful for scenarios where timely insights are critical, such as monitoring IoT devices or tracking live events.
6. Collaboration and Sharing
Azure’s cloud infrastructure supports collaboration by enabling users to share Power BI reports and dashboards with colleagues easily. This fosters a collaborative environment where insights can be shared and acted upon quickly.
7. Cost Efficiency
Azure’s pay-as-you-go pricing model allows organizations to manage their BI costs effectively. You only pay for the resources you use, which can lead to significant cost savings compared to traditional on-premises solutions.
8. Integration with Other Microsoft Services
Power BI’s integration with Azure is part of a broader ecosystem that includes other Microsoft services like Office 365, Dynamics 365, and the Power Platform. This integration ensures a seamless experience across different tools and enhances productivity by allowing users to leverage familiar interfaces and workflows.
In summary, Power BI’s integration with Azure Cloud provides a powerful combination of scalability, security, advanced analytics, and cost efficiency. This integration enables organizations to harness the full potential of their data and make informed decisions based on real-time insights.
CONCLUSION
Thank you for reading this article on Power BI’s journey to the top. If you’re interested in learning more about Power BI, explore our Power BI courses available here or on the Udemy platform. Stay tuned for more insights and updates from ARTIFICALAB LTD!


